ERA is a dynamic dataset and web portal. Thus, we often add new data.
Currently we are updating the dataset by screening an additional 1,628
articles published between 2013-2018. Future updates may include data found
with new keywords or on new technologies and new outcomes. Please do not
hesitate to contact us with any questions about the status of what is
available on-line: icraf-era@cgiar.org
Quick start guide
Examine Outcomes
How does adoption of agricultural technologies change outcomes critical for resilient agriculture
such as yield, income, soil health and biodiversity?
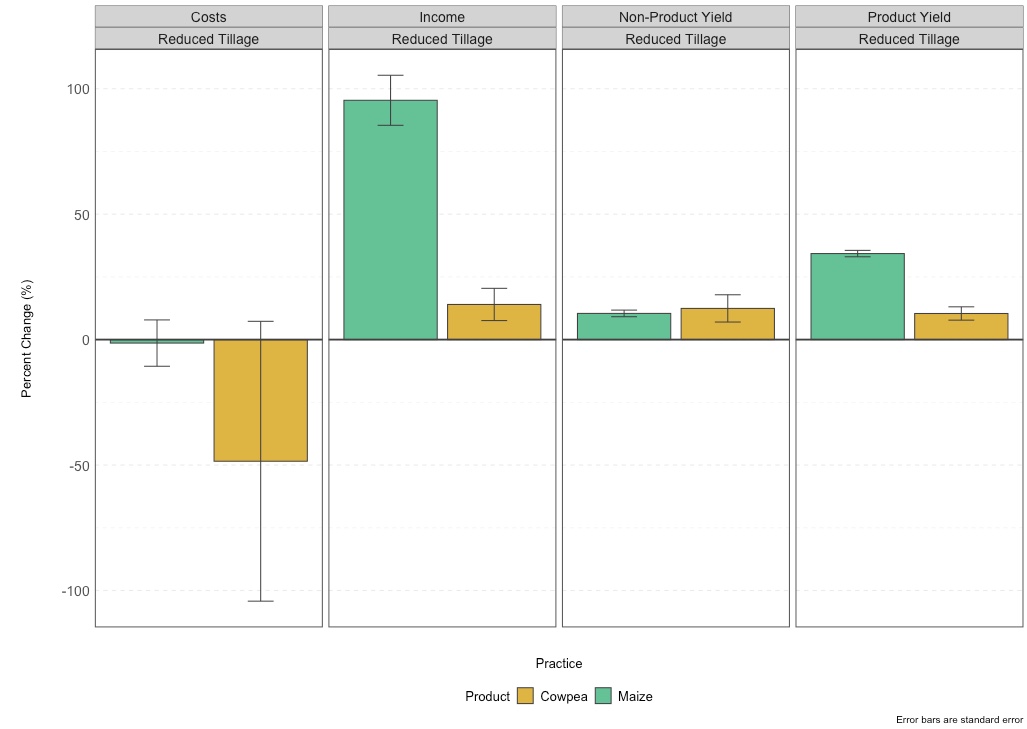
Using Examine Outcomes,
the user selects up to three practices and three products they are interested in evaluating.
Outcomes can be explored at the Pillar level (productivity, resilience, mitigation),
the Outcome level (yield, income, soil quality, etc.),
or at the Indicator level (crop yield, gross returns, soil carbon, erosion, etc.).
Bars show mean percent change in the chosen outcome across all the data available in
ERA for the selected product and practice combination. Error bars represent standard error of the mean.
Figure 1. Examine outcomes is ERA101.
This example shows how it allows the user to interrogate the relationship among three practices at multiple
levels of aggregation for outcomes for three products.
Assess climate-smartness across practices
Understanding the expected performance of a management practice or technology in terms of its effects on productivity,
resilience and mitigation—but each independently—is crucial when deciding whether to use it.
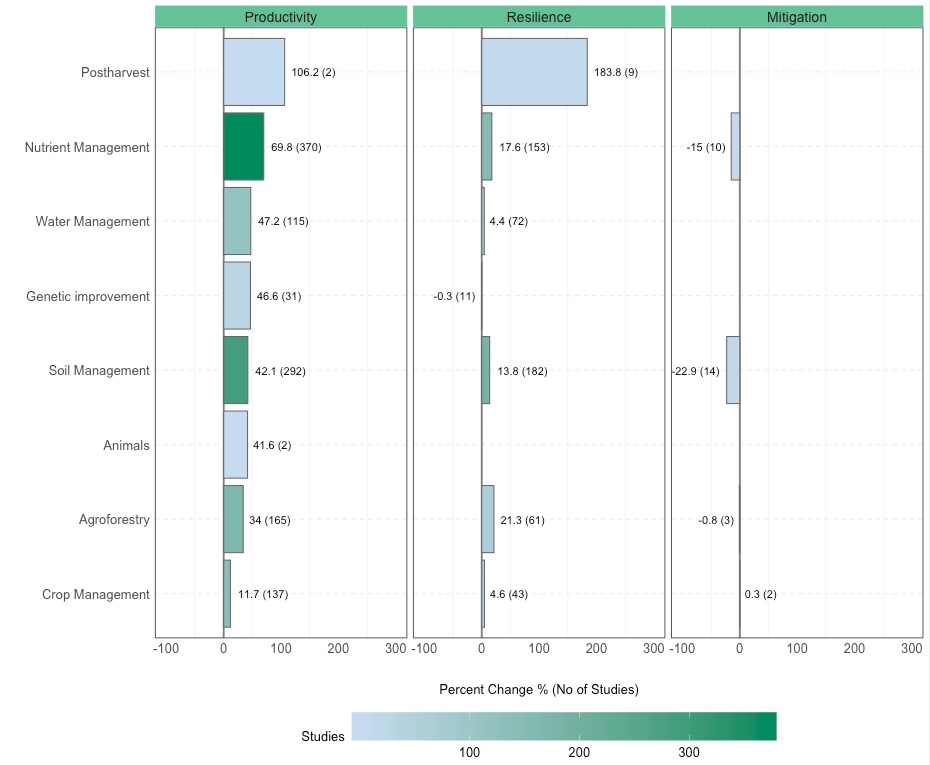
Using Assess Climate-Smartness,
users selects the specific management practices and technologies of interest.
They also specify whether they want to include data from papers where the practice was used by itself (solo)
or in combination with other practices (combo), specific agroecological zone of interest, products, a
nd temperature and precipitation constraints.
The visualization responds by filtering and calculating the effects size (percentage change for the studies
that match the filters) and maps them to the respective objective.
Mean is reported, and number of studies is reported in parentheses.
The response can be aggregated to management level (theme) or technology level (practice).
Blanks show where there are no data in the database.
Figure 2. Assess climate-smartness enables the user to dive deep to examine how management
practices and technologies affect productivity, resilience and mitigation.
Identify interactions between technologies
Management practices and technologies can be applied by themselves or in combination with
additional ones (‘technology bundles’).
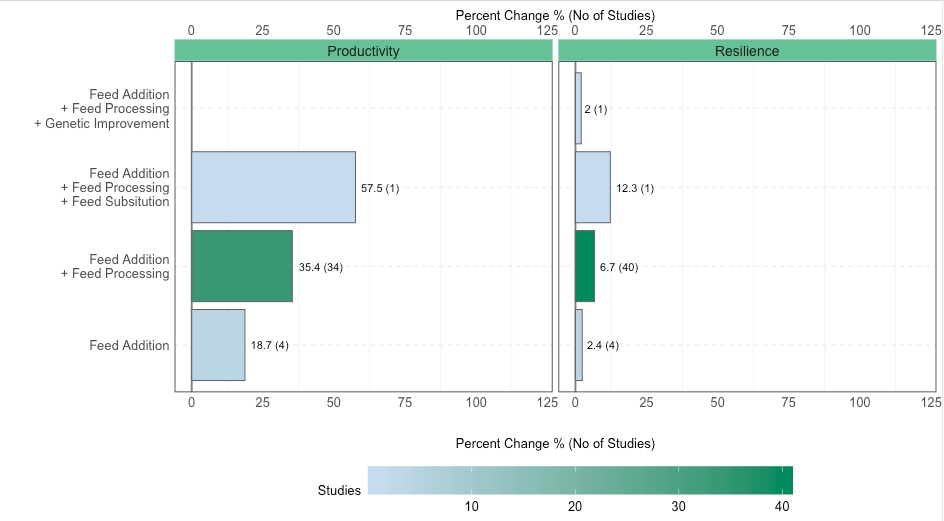
With Identify Interactions,
the user explores whether there are beneficial or antagonistic effects of
using a practice in a bundle rather than alone.
The user chooses a specific practice (e.g., alley cropping).
The tool responds by selecting all of the observations that use that technique either alone
or in combination and then calculating the effects of that practice on
aggregated indicators of productivity, resilience and mitigation.
The outcome is reported as the average effect weighted by the number of observations and studies (in parentheses).
The user also can select a number of other filtering options to hone in on specific topics of interest.
Figure 3. Identify interactions allows the user to find out more details about the how combinations
of management practices affect outcomes.
Discover synergies & tradeoffs between outcomes
Changing farm management practices affects multiple outcomes simultaneously.
Sometimes those effects are all positive (synergies),
sometimes some are positive and some negative (tradeoffs),
and sometimes all outcomes are negative (bad news).
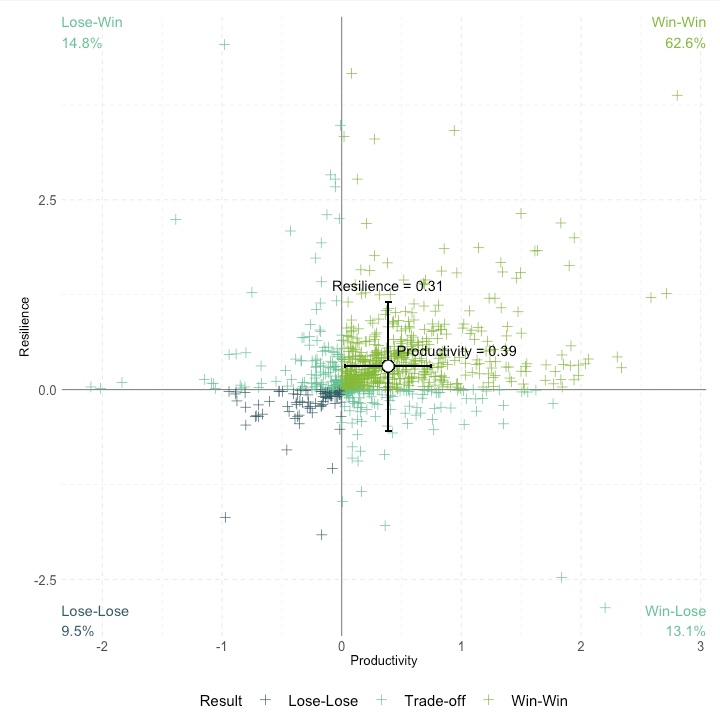
Using Discover Synergies,
the user chooses and filters a number of categories.
The system then subsets the database to match the selection and maps the calculated effects
in two-dimensional space.
The system also returns the percentage of the data that falls within each quadrant.
The axes of this graph are on a log scale (ln), with 0.5 roughly equal to a 60% change and 1.0
slightly more than 200% change.
Figure 4. With Discover synergies and trade-offs,
the user can see the aggregate and variability of effects
management practices and technologies have on productivity and resilience.
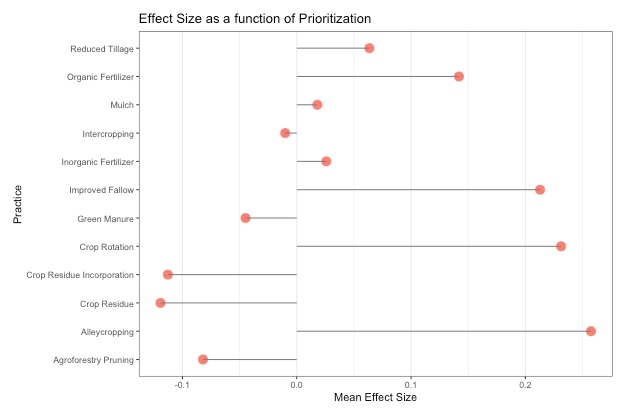
Prioritize practices based on outcomes of interest
Different users value outcomes in different ways.
For example, one may care a lot about increasing productivity while another may give more weight
to building resilience. With Prioritize Options, in the “Lab”,
the user can explore scenarios for prioritizing practice for different values on productivity and
resilience outcomes.
Users first sets the relative weighting of the two outcomes on the slider bar: 0.5 = equal weighting
on productivity and resilience, greater than 0.5 put more weight on productivity and less than puts
less weight on productivity.
Users can also select the data of interest by level of aggregation, products or countries similar
to the other use cases.
The system responds by providing a revised average effect size for the respective theme or practice.
The value represents the average of the aggregated effect size for productivity and resilience for
the respective practice weighted according to the user’s selection and is on a log scale.
Figure 5. With Prioritize options, the user sets the relative value of the two outcomes
according to their own preferences allowing them to see how different goals may change the relative
value of different management options.